from palmerpenguins import load_penguins
from palmerpenguins import load_penguins_rawPalmer Penguins
Replacing Flowers with Flightless Arctic Birds
Introduction
This page presents information about the Palmer Penguins dataset which will be used throughout the CS 307 notes.
A duck walks into a drugstore to purchase some lip balm.
While checking out, the cashier asks: “Will that be cash or credit?”
The duck responds: “Put it on my bill.”
– As told by Andrew “Andy” Glaysher, BS Media Studies, 2009
Source
The Palmer Penguins data were originally collected and made available by Dr. Kristen Gorman and the Palmer Station, Antarctica LTER, a member of the Long Term Ecological Research Network.
- Gorman KB, Williams TD, Fraser WR (2014). Ecological sexual dimorphism and environmental variability within a community of Antarctic penguins (genus Pygoscelis). PLoS ONE 9(3):e90081. https://doi.org/10.1371/journal.pone.0090081
The data as used here is derived from the palmerpenguins Python package that is a port of the palmerpenguins R package. Use the load_penguins() function from either package to obtain the data as originally published via these packages, however, that is not the data you should use for lab in CS 307.
- Horst, AM, Hill, AP, & Gorman, KB (2020).
palmerpenguins: Palmer Archipelago (Antarctica) penguin data. R package version 0.1. 0. https://allisonhorst.github.io/palmerpenguins/. doi: 10.5281/zenodo.3960218.
The Penguins
Meet the Palmer Penguins: Chinstrap, Gentoo1, and Adelie! Artwork by Allison Horst.
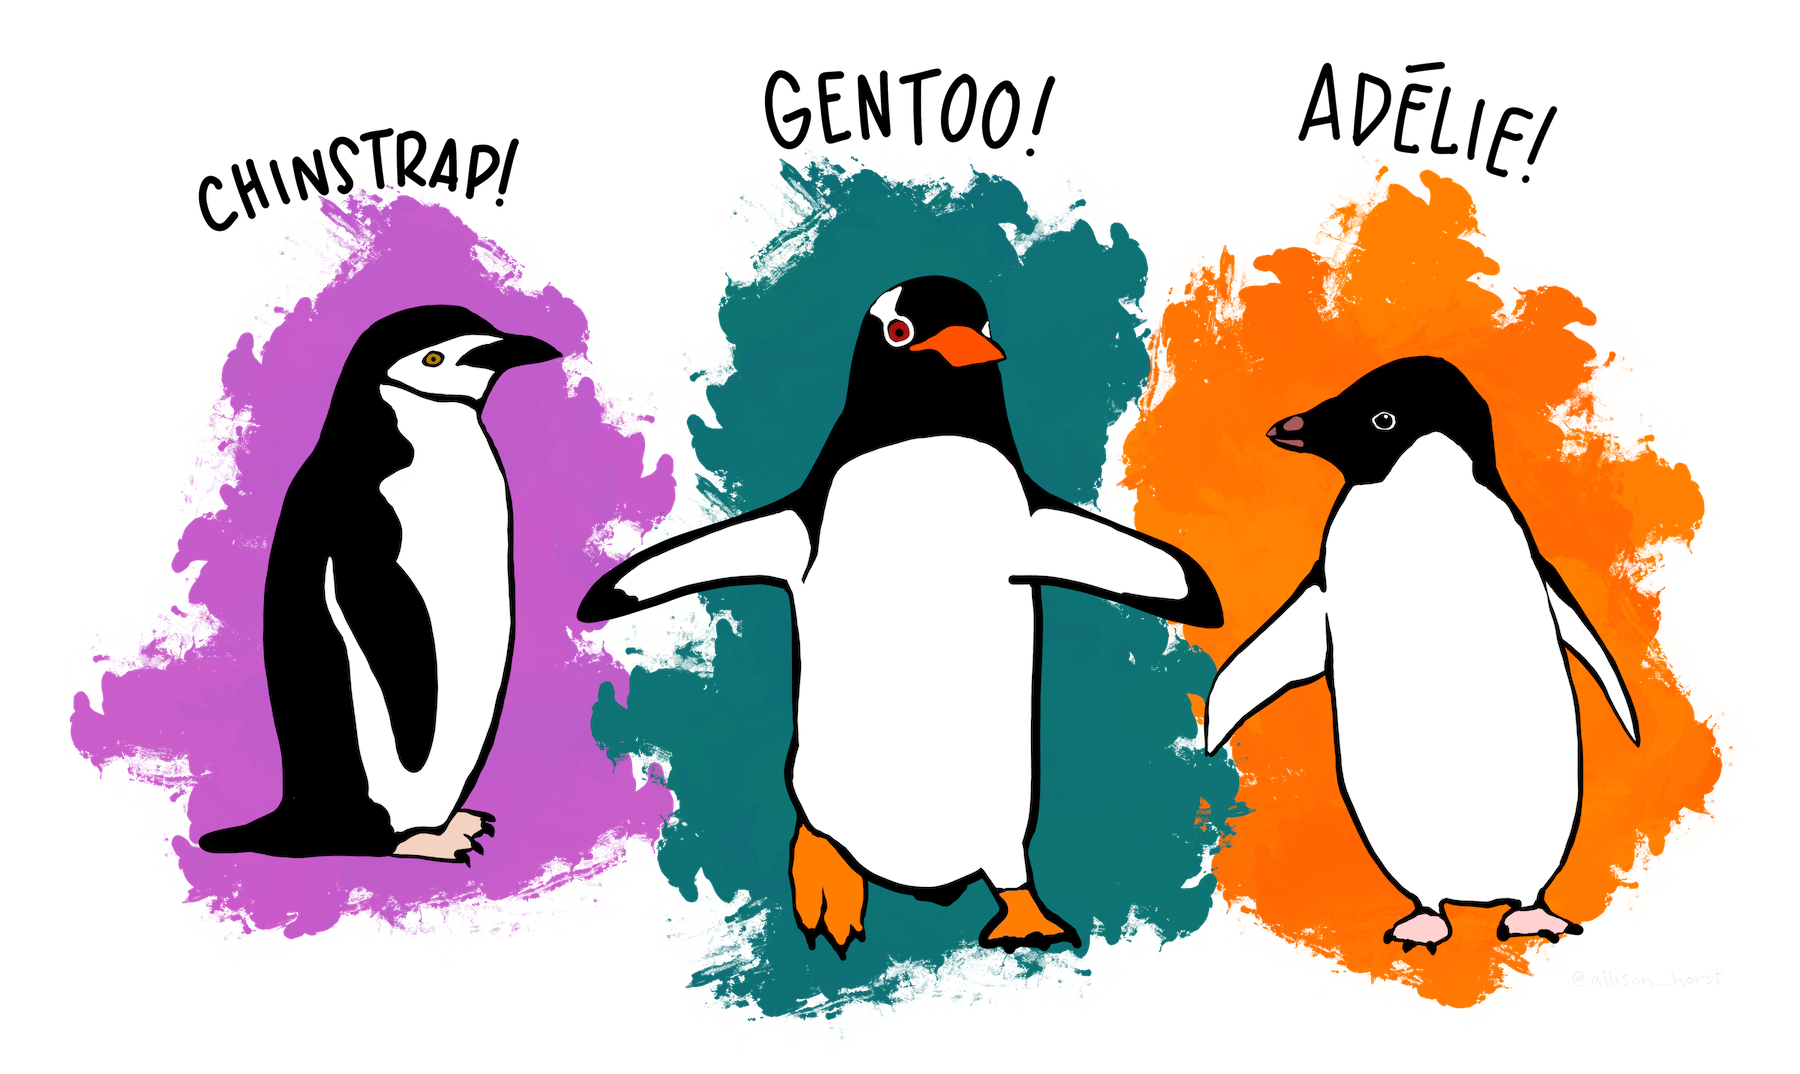
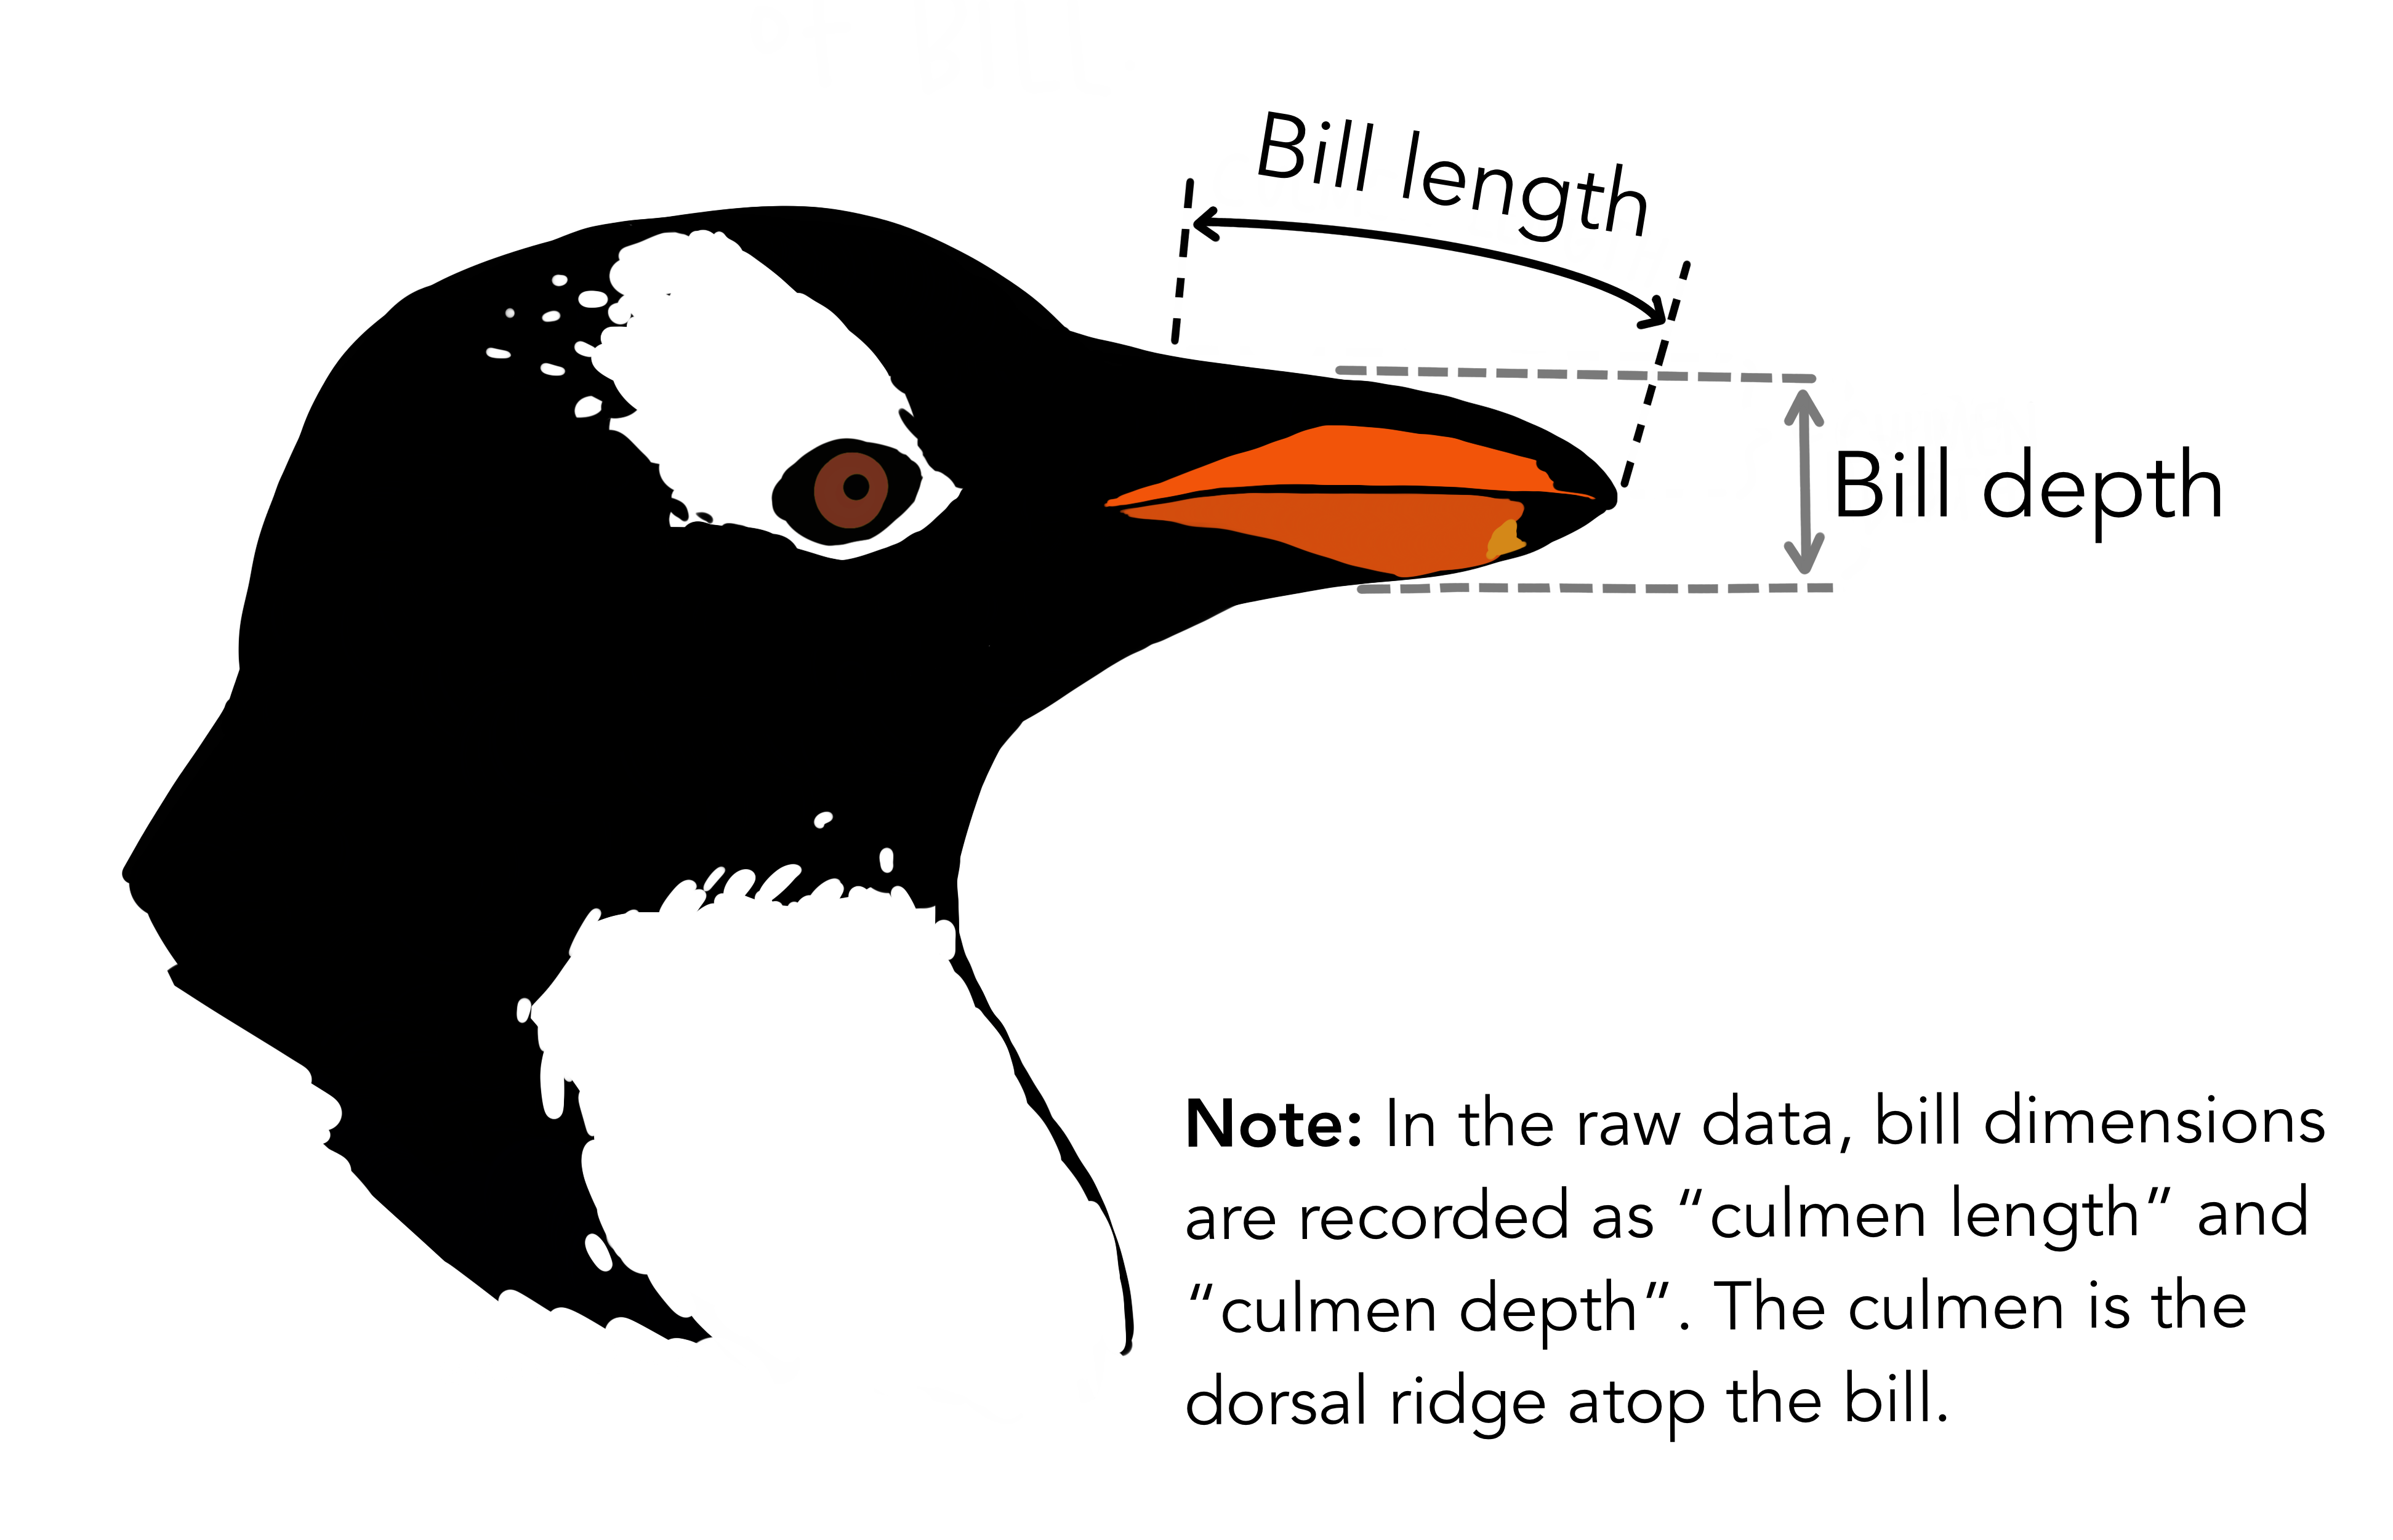
In lab, we will focus on the length and depth of the penguins’ bills. We’ll attempt to use these measurements to predict the species of each penguin.
Data Dictionary
The Palmer Penguins dataset includes size measurements for adult foraging penguins near Palmer Station, Antarctica. The data includes measurements for penguin species, island in Palmer Archipelago, size (flipper length, body mass, bill dimensions), and sex.
species
- a string denoting penguin species (Adélie, Chinstrap and Gentoo)
island
- a string denoting island in Palmer Archipelago, Antarctica (Biscoe, Dream or Torgersen)
bill_length_mm
- a number denoting bill length (millimeters)
bill_depth_mm
- a number denoting bill depth (millimeters)
flipper_length_mm
- a number denoting flipper length (millimeters)
body_mass_g
- a number denoting body mass (grams)
sex
- a string denoting penguin sex (female, male)
year
- an integer denoting the study year (2007, 2008, or 2009)
Data in Python
The Palmer Penguins data can be access in Python using the palmerpenguins package.
The load_penguins function returns a Pandas DataFrame containing the data described in the above data dictionary.
penguins = load_penguins()
penguins| species | island | bill_length_mm | bill_depth_mm | flipper_length_mm | body_mass_g | sex | year | |
|---|---|---|---|---|---|---|---|---|
| 0 | Adelie | Torgersen | 39.10 | 18.70 | 181.00 | 3,750.00 | male | 2007 |
| 1 | Adelie | Torgersen | 39.50 | 17.40 | 186.00 | 3,800.00 | female | 2007 |
| 2 | Adelie | Torgersen | 40.30 | 18.00 | 195.00 | 3,250.00 | female | 2007 |
| 3 | Adelie | Torgersen | NaN | NaN | NaN | NaN | NaN | 2007 |
| 4 | Adelie | Torgersen | 36.70 | 19.30 | 193.00 | 3,450.00 | female | 2007 |
| ... | ... | ... | ... | ... | ... | ... | ... | ... |
| 339 | Chinstrap | Dream | 55.80 | 19.80 | 207.00 | 4,000.00 | male | 2009 |
| 340 | Chinstrap | Dream | 43.50 | 18.10 | 202.00 | 3,400.00 | female | 2009 |
| 341 | Chinstrap | Dream | 49.60 | 18.20 | 193.00 | 3,775.00 | male | 2009 |
| 342 | Chinstrap | Dream | 50.80 | 19.00 | 210.00 | 4,100.00 | male | 2009 |
| 343 | Chinstrap | Dream | 50.20 | 18.70 | 198.00 | 3,775.00 | female | 2009 |
344 rows × 8 columns
Show Code for Plot
import seaborn as sns
import matplotlib.pyplot as plt

plot = sns.jointplot(
    data=penguins,
    x="bill_length_mm",
    y="bill_depth_mm",
    hue="species",
    edgecolor="k",
    alpha=0.75,
    space=0,
)
plot.set_axis_labels(
    xlabel="Bill Length (mm)",
    ylabel="Bill Depth (mm)",
)
plot.ax_joint.legend(
    title="Species",
    loc="lower left",
)
plt.show()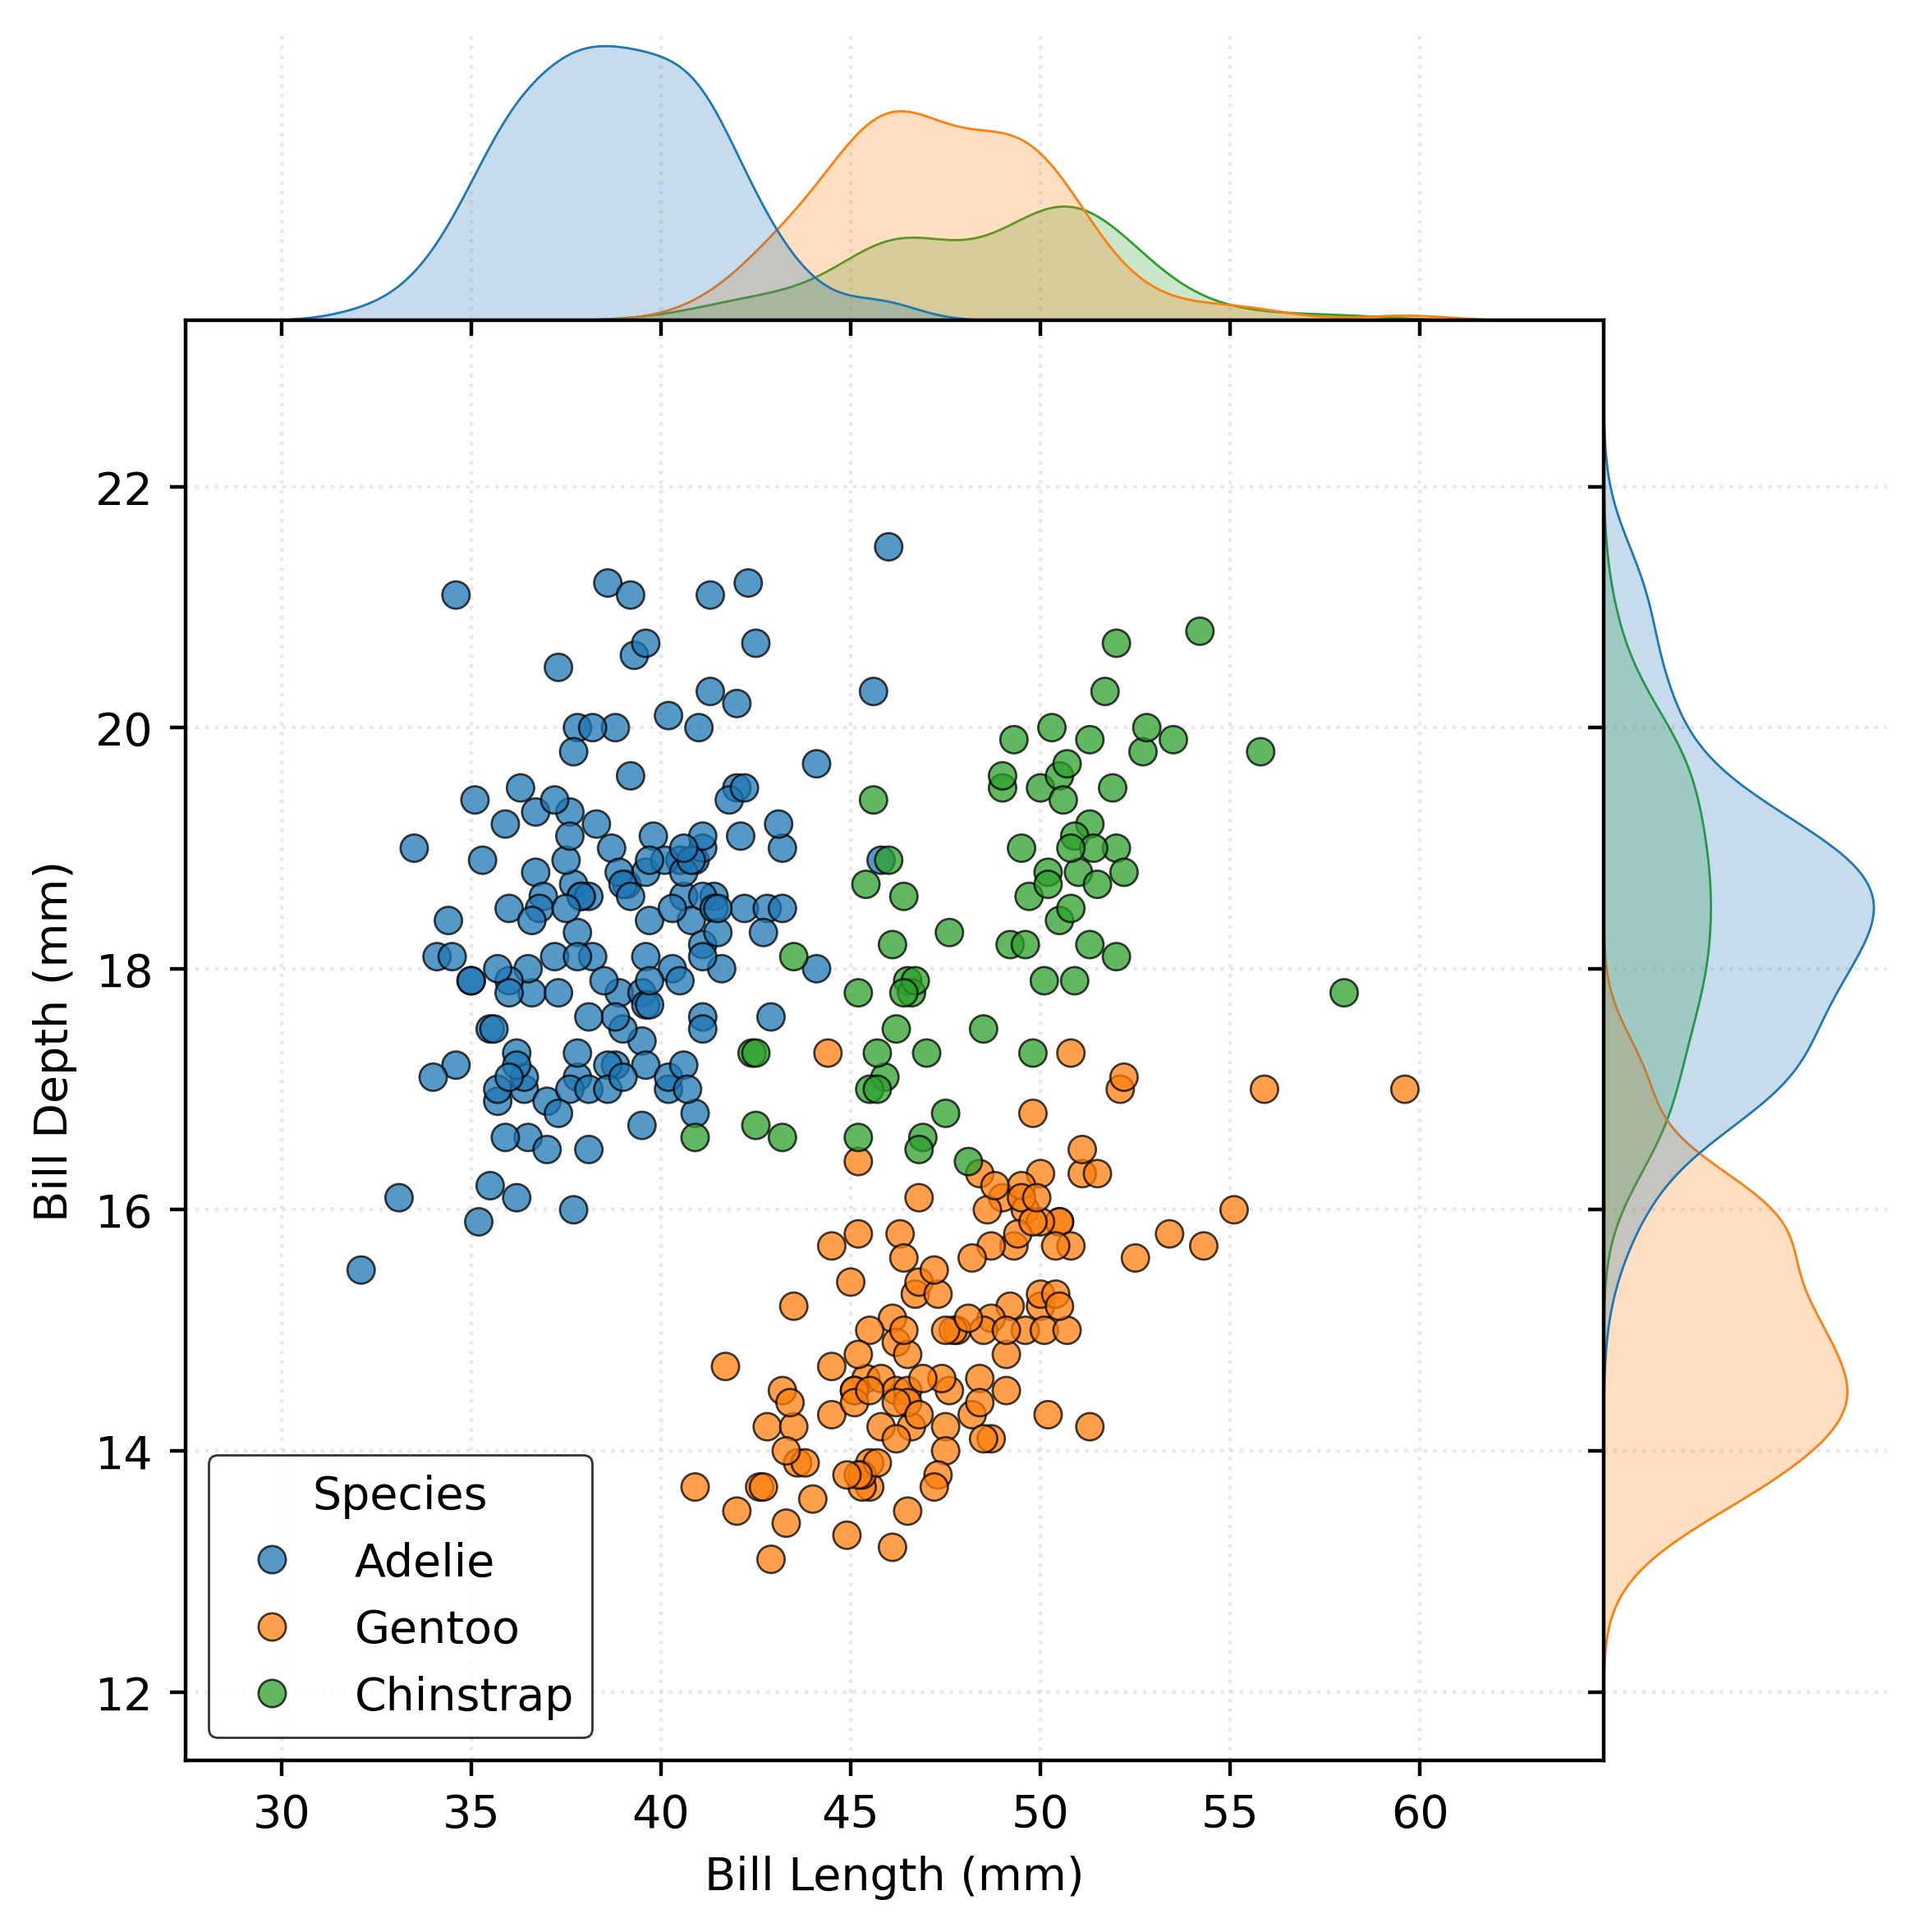
The original data can be loaded via the load_penguins_raw, but this data is used infrequently.
History
As you move through your journey as a data scientist, you’ll like encounter the Palmer Penguins dataset with some frequency. An interesting question is, why?
In many ways, the Palmer Penguins data is meant to replace the even more ubiquitous Iris flower data. This again leads to the question, why? In many ways, it is a better dataset because it is useful for everything that the Iris data was, but also more.
The Palmer Penguins data…
- uses a permissive CC0 license.
- uses understandable variables.
- has complete metadata and documentation.
- is a manageable, but less trivial size than the Iris data.
- is real world, not simulated data.
- includes addition feature variables, including categorical variables, as well as missing data, providing more opportunity for usage and learning.
This reasoning is expanded upon in the R Journal article introducing the dataset.
All that is wonderful, but there was another compelling reason to move away from the Iris data, eugenics. How on earth are flowers related to eugenics?
If you study statistics for any length of time, you’ll start to notice that many methods and theories can be traced to one person, Ronald Aylmer (R.A.) Fisher.2
Like many of his contemporaries, Fisher’s interest in statistics and biology cannot be separated from his interest in and study of eugenics. While this is a very unfortunate part of the history of statistics, it cannot simply be ignored. Many of the most foundational statistical methods were developed by researchers and scientists at least interested in if not pursuing eugenics. If you were not already of the mind that statistical methodology should be applied with great care and ethical consideration, hopefully this history will change your perspective.
But how does this all relate to flowers? Well, the Iris data often goes by another name: Fisher’s Iris data set.3 If we stopped using all of Fisher’s creations in statistics, we might not be left with much. But this particular artifact was also published in the Annals of Eugenics.
For additional reading and background:
Footnotes
Linux users might recognize the Gentoo name.↩︎
Interestingly, among his many faults, Fisher did not believe that smoking caused cancer. Especially at the time, his argument was not completely without merit, but his thoughts on the topic were used to combat the arguments made by the Surgeon General’s report in the 1960s making the claim that smoking caused cancer..↩︎
The data was actually gather by Edgar Anderson, so you will also see it referred to as Anderson’s Iris data set.↩︎